Business Analytics and Business Enablement
Unlocking the Power of Your Data with Innovative Data Analytics Solutions
SME Solutions Group offers complete platforms with ready-to-use enterprise data services for a wide variety of workloads and data. Offering valuable, actionable insights from all types of data—in the cloud, on-premises, or in a hybrid deployment—SME empowers business users, data engineers, and data scientists to access and process relevant data, evaluate predictions, and make quick, accurate decisions.
Challenges We Resolve Through Data Analytics Consulting Services
Right Data, Right People, Right Time
Disruptive Process Fragmentation
Lack of Alignment Between Data and IT Team
.png?width=333&height=2000&name=Untitled%20design%20(47).png)
How We Help You Treat Data as a Corporate Asset
Our expertise lies in crafting and implementing data strategies to enhance your competitive edge and safeguard the future of your organization. Collaborating with you, with the guidance of a data consultant, we identify data opportunities and essential analytics scenarios, conduct a thorough assessment of your data capabilities, and assist in developing and deploying a robust data architecture aligned with your business goals.
- Data Strategy Consulting and Design
- Data Innovation
- AI Readiness and Strategy
- Business Use Case Solutioning and PoСs
- Data-as-a-Service
- Data-as-a-Product
Empower your organization with modern data platforms that streamline data management, effortlessly enable data products, and provide valuable insights for informed business decisions. Partnering with leading providers such as AWS, Azure, Snowflake, GCP, and Databricks, we deliver robust and scalable data platforms and data warehouse consulting that facilitates seamless data ingestion, processing, and integration.
- Data Warehouse / Lake / Lakehouse Platforms
- Data Fabric / Mesh
- Multi-Modal Data Storage, Processing, and Access
- Scalable Storage and Optimized Processing
- Modern Cloud / Hybrid / On-Prem Data Architecture
- Data Virtualization and Semantic Layer
We specialize in turning your data into a valuable asset that can be shared with both internal and external stakeholders. Our expertise lies in providing actionable insights through cutting-edge data visualization, interactive dashboards, and self-service analytics. Additionally, we excel in crafting predictive models, conducting thorough data analysis, and utilizing machine learning algorithms to reveal intricate data patterns and tackle intricate business challenges.
- Self-Service BI and Analytics
- Data and Analytics Products with AI/ML Capabilities
- Data Monetization
- Data Distribution / APIs / Sharing / Marketplace
- Data Visualization and Data Portals
- Interactive and Mobile BI
- Prescriptive and Predictive Analytics
- Real-Time / Streaming Analytics
- Decision Optimization / Automation
- Intuitive Data Visualization of Complex Data
In order to prepare your business for the future, we specialize in crafting cutting-edge data solutions and managing the seamless migration of your data with minimal impact on your day-to-day operations. Our goal is to streamline and refine the migration process, offering tailored recommendations that align perfectly with your business needs.
- Migration Strategy
- Migration Efforts Estimation
- Scope Optimization Recommendations
- Replatforming and Rearchitecting
Our expertise spans across various data tools and technologies such as data warehouses, data lakes, data mesh, and data catalogs. We excel in building high-performance infrastructure through the development of data pipelines and the implementation of data standards and procedures, ensuring seamless integration across multiple systems and sources.
- Modern Data Engineering Stack
- Data Integration, Modelling, and Transformation (ETL/ELT)
- Data Pipelines / Orchestration / Quality Management / Observability / Monitoring / CI/CD / Automation
- Scalable and Flexible Data Ingestion, Rapid Data Onboarding, CDC
Our expertise lies in maintaining a seamless process of gathering and safeguarding top-tier data across the organization while ensuring controlled data access. We craft user-friendly data management solutions that provide precise data and analytics to empower decision makers with valuable insights to drive your business forward.
- Data Governance
- Data Quality Management
- Metadata / Lineage / Catalog / Data Discovery
- Data Architecture
- Data Harmonization and Consumption
- Lifecycle Management
- Data Security / Privacy / Access Control / Compliance
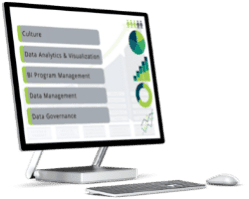
BI assessment
Take this Business Intelligence (BI) assessment to gain valuable insights into the current state of your data maturity. By completing this assessment, you will uncover key areas of strength and opportunities for improvement within your data strategy and management processes.
Customer Success Stories
SME Solutions Group provides analytics and enterprise data services to clients nationally in nearly every industry.
Inventory Analytics For Data-Driven Inventory Management
A modern data stack and robust BI strategy provides insights into customer behavior, product, and channel performance.
Optimizing Data Management With Cloud Solutions
Modern data management and storage streamline processes, cut costs, and improve data-driven decisions.
Building User Confidence While Reducing Cloud Computing Costs
Kforce migrated from costly, legacy ETL processes to a modern approach that has widespread positive impacts on the business.
Our Latest Insights on All Things Data & Analytics
Azure Synapse vs Snowflake: Cloud Data Warehouse
The distinction between cloud and on-premises data warehouses lies in their deployment architectures, with cloud platforms offering unparalleled scalability, flexibility, and cost-effectiveness.
Snowflake and Azure Synapse are at the forefront of cloud data warehouse and lakehouse platforms, revolutionizing data management for the modern era.
When making the decision between Azure Synapse and Snowflake, organizations must carefully consider their specific data management needs and priorities.

SME Solutions Group's AI Readiness Ki
Ignoring AI readiness in today's landscape is like missing the boarding call to the future of business.
In this guide, we help organizations think ahead about their AI readiness and lay a strong foundation for success. This involves assessing their data infrastructure, fostering a culture of innovation and understanding, and establishing clear governance frameworks. By taking these proactive steps, organizations can ensure AI becomes a powerful tool for growth, not a disruptive force for chaos.
.jpg?quality=low&width=160&height=124&name=Download%20the%20eBook%20How%20to%20Get%20Ready%20for%20AI%20(1).jpg)
Dbt Core Vs. Dbt Cloud: Which Is Right For You?
dbt Core and dbt Cloud are both powerful tools for data transformation. dbt Core offers flexibility and control, while dbt Cloud provides a managed environment and additional features. By understanding the differences and considering your specific needs, you can choose the right solution for your data transformation workflows.
Ultimately, the right solution for you depends on your unique requirements and constraints. Consider the features, infrastructure needs, scalability, ease of use, and cost to make an informed decision.
Industry-Specific Data Analytics Consulting Experience
.jpg?width=760&height=591&name=SME%20Solutions%20Group%2c%20Finance%20(1).jpg)
Finance

Healthcare & Life Sciences
Retail & Distribution

Energy and Utility
Our Partners
We partner with top tech companies to deliver best-in-class solutions to our clients.







Data and analytics: the foundation of your AI journey
 Data and analytics strategy
We will align your analytics strategies to measurable business results using a data-centric approach.

Data discovery and augmentation
Enhance your data assets with third-party data and predictive analytics to provide a comprehensive 360-degree view of your customers.

Data management and beyond
Beyond just data synthesis and analytics, our expertise extends to governance, monetization, and compliance assistance.

Data democratization
Our customized tools empower team members to effortlessly leverage data and confidently journey towards achieving AI excellence.

Industrialized solutions
We provide ready-to-use analytics and AI solutions for common issues, along with personalized solutions for specific requirements.
Business Analytics
To get started on your analytics journey or improve your data strategy, we offer a complimentary discovery session, which provides an opportunity for you to meet a data consultant and discuss your goals and needs. During this session, we'll work with you to identify potential areas for improvement and explore how we can help you achieve your objectives.
.png?width=375&height=150&name=Untitled%20design%20(43).png)
