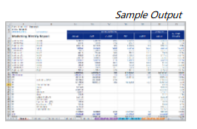
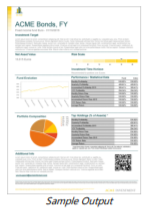
Across an organization, there are many different types of people that can benefit from analytics outside of the business analysts and power users.
As user communities broaden, there is a spectrum of skill sets – ranging from those who perform ‘light’ creation, to larger communities of interactive users that want to explore and search within analytics apps and dashboards, to purely passive consumers that utilize static forms of information delivery, inside and outside the organization. It is important to be able to serve all users and use cases from a common, governed platform. Collaborative analytics and reporting allows an organization to deliver information and insights to all consumers in widely adopted, portable formats. When delivered through a common analytics platform, it ensures that data and analytics are consistent and accurate.
SOLUTION OVERVIEW
This solution utilizes Qlik Sense® and NPrinting and is applicable to all industries looking to improve their reporting capabilities and enable collaborative data analytics.
Key Functions:
- A single solution for advanced reporting and distribution
- Seamless integration with a platform that ingests multiple data sets
Key Features:
- Develop reports with drag-and-drop simplicity
- Filter information for customized reports relevant to the user
- Automate reports to be emailed out when KPI’s or thresholds are met
- Schedule reports leveraging BI visualizations at any frequency
Several ways businesses are achieving success include:
- Improving Customer Satisfaction
- Making Confident Decisions
- Eradicating repetitive employee administration
- Improving the visibility of key data
The Business Challenge
All companies have some sort of process that includes generating and distributing reports but is it always the right reports to the right people and at the right times?
Static reporting requires time and effort to produce something that will almost always become instantaneously outdated.
Example for a high-end resort: At the beginning of each day, all managers receive a report detailing out the resort’s expectant arrivals, weather forecast, and onsite staff. Managers find that the end of the day reports never match and they were unprepared for unexpected arrivals or inclement weather.
The Approach
There are many methods to solve reporting dilemmas but two that stick out are: business intelligence (BI) integration and automated report generation and distribution. Even more, combine these options to improve the quality and efficiency of business decisions.
BI pulls data together into a user-friendly and easy to consume package, or dashboard. The purpose of these dashboards, whether it be a high level executive dashboard or individual performance tracker for a specific product, is to have users interact with the data.
Example: The resort managers are able to pull up a BI dashboard, with data being reloaded every hour, and drill down to learn more about their unexpected arrivals.
Automated reporting software allows reports to be tailored by department, customer group, business flags and thresholds. These customized reports are relevant to the users that receive these at the predetermined frequency or when a threshold is met.

Example: Resort managers are automatically sent an email alerting them anytime the forecast predicts a 50% chance or higher of rain. Or are notified when capacity hits 90% and the report includes a link to an interactive application, allowing them to ‘click through’ and explore further.
The Business Value
The business value delivered by undertaking a project like this is substantial. Let the data and the software do the work allowing
you to focus on what to do with the insights. By combining BI dashboards and automated reporting software, actionable data analysis is automatically put in front of the entire organization. 
Example: Resort managers are confident and efficient in their decision to bring in additional staff based on capacity.
Next Steps
SME’s consultants operationalize companies’ existing data, providing a true, real-time evaluation of their current business landscape. Reach out to SME Solutions Group to learn about this use case and others.
.png?width=700&height=127&name=Blue%20Mantis%20formerly%20known%20as%20SME%20Solutions%20Group%2c%20Inc.%20(GREEN).png)


